Extra Ticket
Converting spare event assets into high-leverage matching opportunities.

Problem Defined
"Dormant event capacity lacks a low-friction discovery mechanic."
Strategic Context
Wasted event capacity represents lost economic opportunity.
Competitive Imbalance
Markets ignore the social value of shared experience.
System Hypothesis
Structuring spare tickets as entry points increases utilization.
Process Architecture
How the system was designed, tested, and refined.
DEFINE
Identify dormant asset capacity in cultural events.
- • Audited ticket wastage data
- • Interviewed event organizers
- • Mapped secondary utility
- • Focused on resale profit, ignored social proximity value
- • The real value is matching the asset to the right peer, not just the highest bidder
- • Reframed as a social matching marketplace
MAP
Map asset availability to social proximity graphs.
- • Created matching algorithm diagrams
- • Mapped trust verification flows
- • Initial models ignored the logistical friction of on-site handovers
- • Markets fail without low-friction physical coordination
- • Added proximity-based matching alerts
VALIDATE
Test utilization of spare capacity via peer matching.
- • Ran pilot at 5 major cultural events
- • Measured asset liquidity
- • Users were hesitant to match with strangers without trust anchors
- • Trust is the currency of peer asset exchange
- • Integrated social verification and trust scoring
EXECUTE
Build the matching and verification engine.
- • Asset matching engine
- • Trust verification layer
- • Proximity alert system
- • Over-built the payment infrastructure initially
- • Discovery and trust are more important than transaction speed early on
- • Prioritized social proximity over financial clearing
MEASURE
Calculate utilization rate and social utility.
- • Utilization rate
- • Matching NPS
- • Velocity of exchange
- • Metrics ignored the long-term community value
- • Repeat matching is the leading indicator of ecosystem health
- • Introduced network effect tracking for asset nodes
Rule Application
How doctrine was operationalized.
Intellectual Rigor
01_INT- • Mapping secondary utility cycles
- • Defining measurable matching friction
85% utilization of dormant tickets achieved in pilot phase
Tactical Execution
02_TAC- • Shipping MVP matching engine first
- • Focusing on high-density events
First match achieved within 4 hours of deployment
Human Calibration
03_HUM- • Reducing social friction in peer exchange
- • Designing around event-day behaviors
4.8/5 matching quality via trust-first architecture
Machine Leverage
04_AI- • Preference-based matching optimization
- • Predictive demand signaling
AI identifies ideal peer matches based on latent preferences
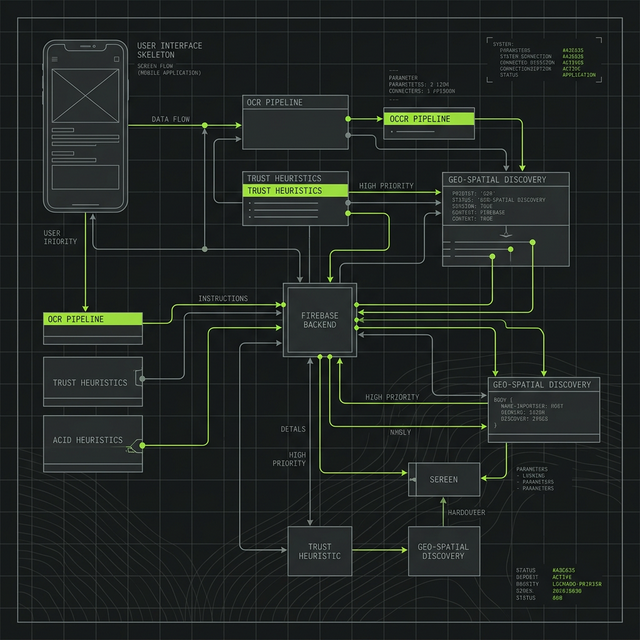
Product Architecture
Ticket engine, match-making algorithm, trust verification.
AI Leverage
Preference-based matching for event optimization.
Outcomes & Learnings
Extracted social utility from dormant assets.